
Reporting lift against control groups
Lift reports are designed to answer one of the hardest questions in marketing measurement:
Did exposure to my brand, creative, or message cause people to think or behave differently?
Many reports can tell you what people think or how groups differ. Lift goes a step further. It isolates the effect of exposure by comparing people who were exposed to a stimulus with a carefully matched group who were not. The result is a clear, defensible view of effectiveness that moves beyond simple correlation.
Lift reports are most useful when you want to:
Prove that a campaign or creative worked
Compare the effectiveness of different stimuli
Understand which outcomes were genuinely influenced by exposure
What a Lift Report Compares
At its core, every Lift report compares two groups:
Exposed respondents
People whose responses indicate they were exposed to a stimulus (for example, they saw an ad or recognised a brand).
Control respondents
People who were not exposed, but who are otherwise similar in terms of key demographics.
The difference between these two groups is the lift.
Step 1: Select Report Type
When creating a new report, choose Lift.
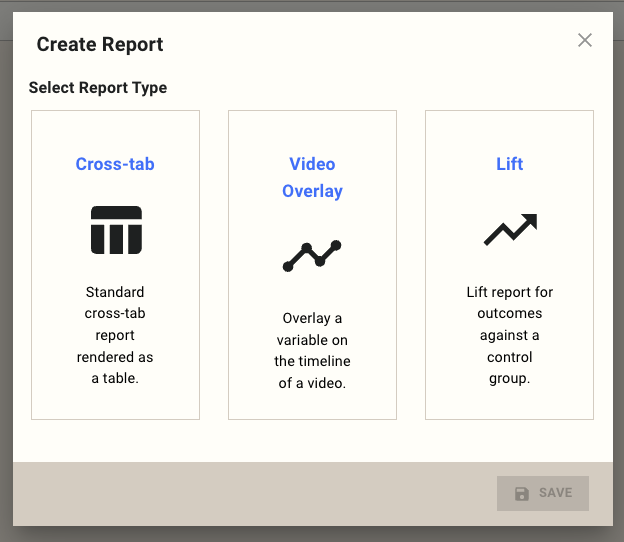
A Lift report is specifically designed to:
Compare outcomes against a control group
Apply demographic matching automatically
Test whether observed differences are statistically meaningful
Step 2: Create Lift Report
This step defines the rules of the analysis: how exposure is identified, how strict the statistics should be, and how stable the results need to be.
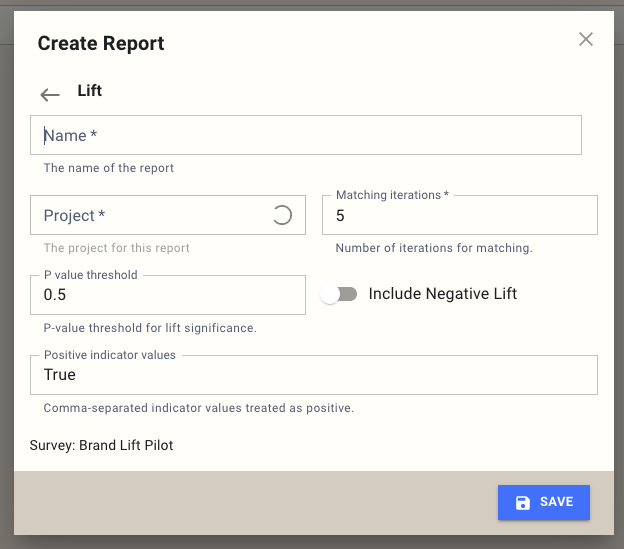
Name
The name is for internal reference and reporting.
Example:
Brand Lift – Spring CampaignChoose something that clearly reflects the stimulus and timeframe being measured.
Project
Select the project this report belongs to. This determines which surveys and responses are available for analysis.
Matching iterations
Lift reports do not rely on a single control group. Instead, they repeatedly rebuild a balanced control group to improve stability.
Each iteration creates a new matched control group
Results are averaged across all iterations
Higher numbers reduce random variation
Typical guidance:
3–5 iterations for early exploration
5–10 iterations for final or client-facing results
Default is 5.
P value threshold
The P value threshold controls how strict the statistical filter is.
Only results with a P value at or below this threshold are shown.
Common interpretations:
0.05 → strong statistical evidence
0.10 → directional but less certain
0.50 (default) → exploratory, surfaces emerging signals
Lower thresholds mean fewer results, but higher confidence.
Include Negative Lift
By default, the report only shows positive lift.
Turning this on will also show:
Outcomes where exposed respondents performed worse than control
This is useful for:
Diagnosing problematic creatives
Understanding unintended effects
Positive indicator values
This defines how exposure is recognised.
Any response matching one of these values is treated as exposed.
Examples:
True Yes SeenValues are:
Case-insensitive
Compared against the Indicator Tag (configured later)
Step 3: Select Report Questions
Next, choose which questions from the survey will be used in the Lift report.
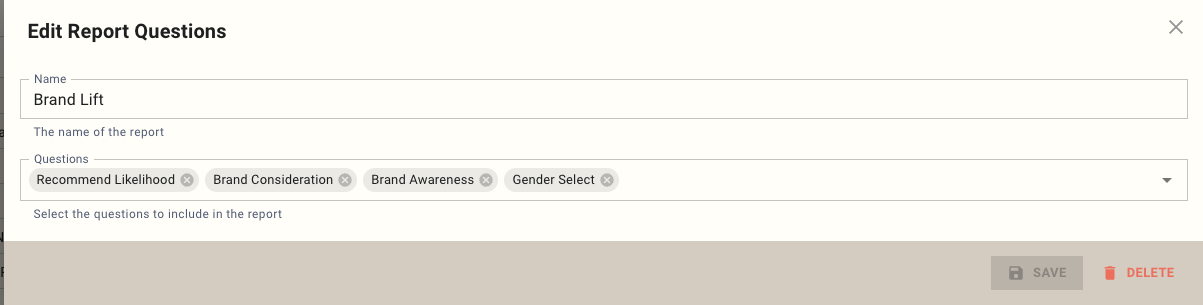
At this stage, you are simply selecting questions.
Their roles are defined in the next step.
Typical selection includes:
Outcome questions (awareness, consideration, intent, recall)
Demographic questions (used for matching)
Step 4: Configure Analysis
This is where the structure of the Lift analysis is defined: which questions are measured, which are used for matching, and how stimuli are interpreted.
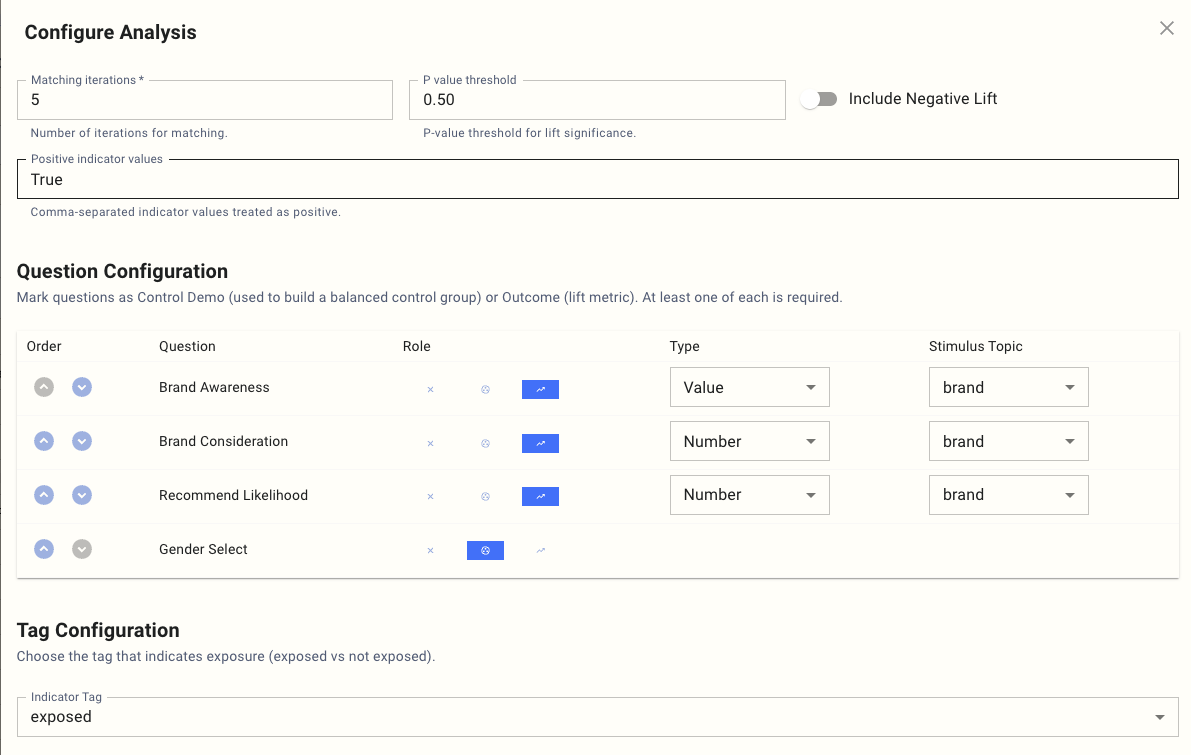
Question Configuration
Each selected question must be assigned a role.
At least one Outcome and one Control Demo are required.
Outcome
Outcome questions are where lift is measured. These represent the behaviours or attitudes you want to influence.
Examples:
Brand Awareness
Brand Consideration
Recommend Likelihood
Message Recall
Each Outcome requires two additional settings:
Type
Stimulus Topic
Control Demo
Control Demo questions are used only to create a balanced control group.
Examples:
Gender
Age Group
Region
Prior category usage
These questions are not measured for lift.
They ensure exposed and control respondents are comparable.
Outcome Types
Value
Used for categorical responses.
Examples:
Yes / No
Brand selected
Option chosen
Lift is calculated separately for each response value.
Number
Used for numeric or scale-based responses.
Examples:
Likelihood (0–10)
Rating (1–5)
Lift is calculated at thresholds (for example, 7+, 8+, 9+).
Stimulus Topic
The Stimulus Topic defines what the outcome is being lifted by.
Examples:
brand
creative
message
This allows the same outcome to be analysed separately for each brand, creative, or message in the data.
Indicator Tag
The Indicator Tag identifies where exposure is stored.
Example:
exposedThis tag is combined with Positive indicator values to classify respondents as:
Exposed
Control
How Lift Is Calculated
For each stimulus value (for example, each brand):
Respondents are split into exposed and control candidates
A matched control group is built using Control Demo questions
Outcome rates are calculated for both groups
Lift is calculated as the difference between those rates
Statistical significance is tested
Results are averaged across matching iterations
Only results passing the P value threshold are shown
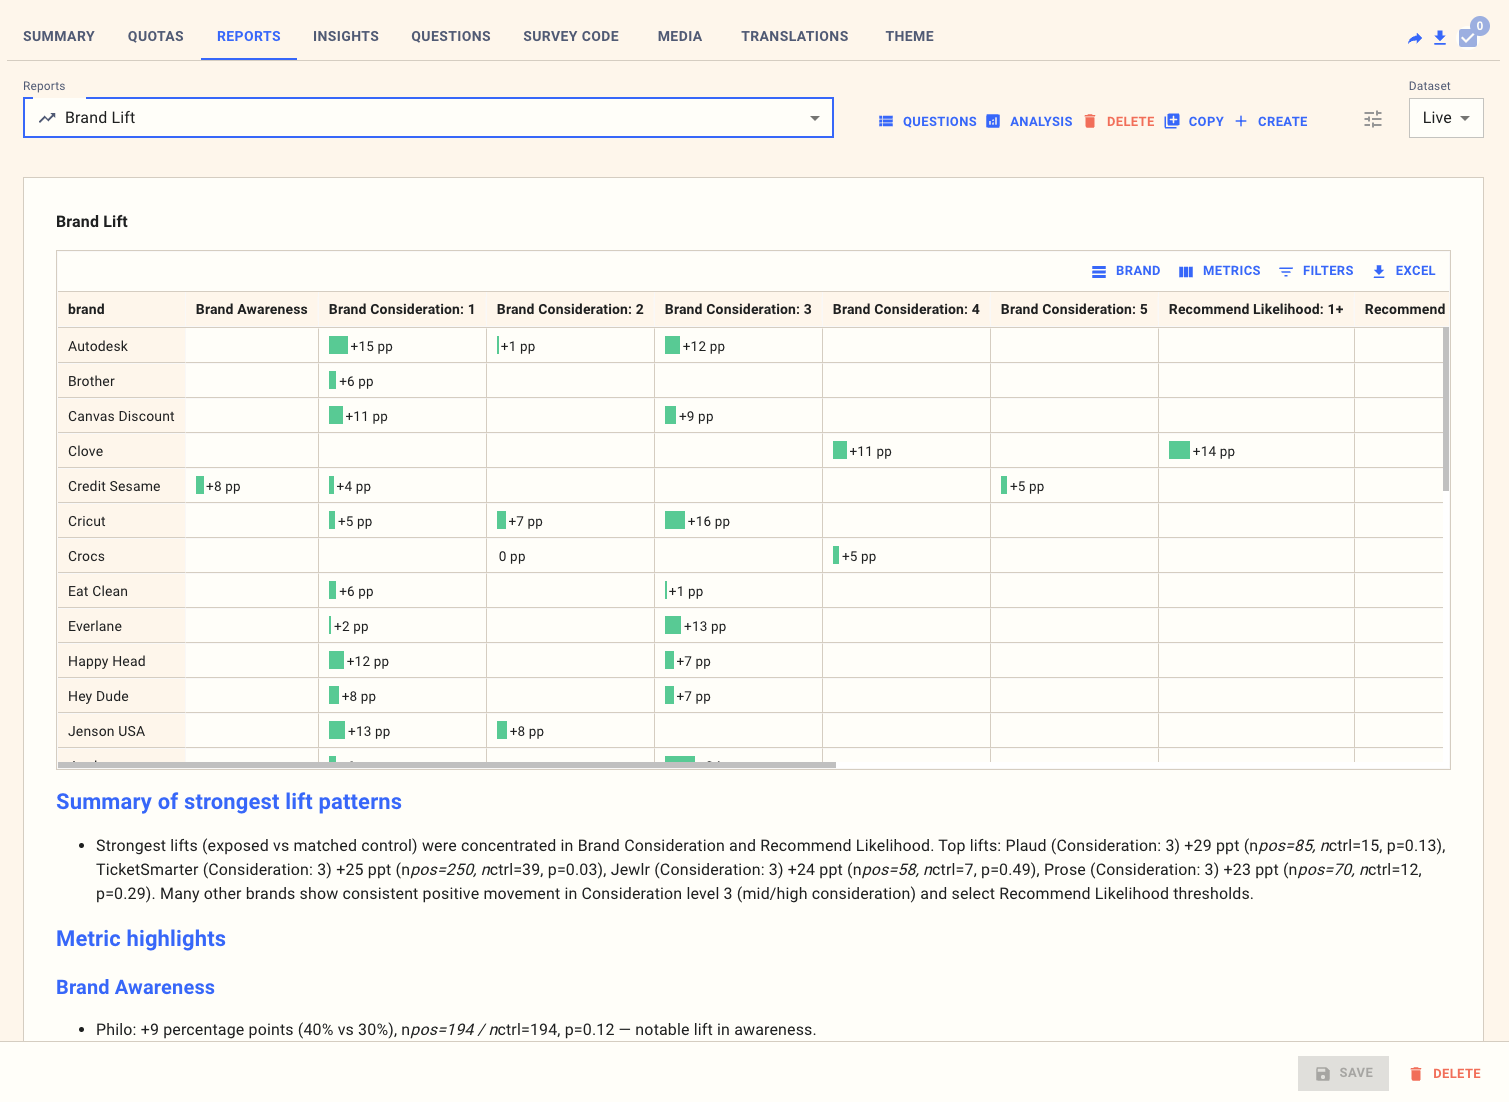
Worked Example: Brand Lift
Scenario
You want to understand whether exposure to a brand campaign increased key brand metrics.
Indicator Tag
exposedPositive indicator values
TrueStimulus Topic
brandOutcomes
Brand Awareness (Value)
Brand Consideration (Number)
Recommend Likelihood (Number)
Control Demo
Gender
Example Result
Brand | Metric | Exposed | Control | Lift |
Brand A | Awareness | 62% | 54% | +8% |
Brand A | Consideration 7+ | 38% | 33% | +5% |
Interpretation
Exposure to Brand A increased both awareness and consideration. The lift indicates a genuine effect of the campaign, not just demographic differences.
Worked Example: Creative Testing
Scenario
You are testing multiple creatives within the same campaign.
Stimulus Topic
creativeOutcomes
Message Recall (Value)
Brand Favourability (Number)
Example Result
Strengths of Lift Reports
Lift reports provide:
A causal view of effectiveness
Automatic demographic control
Clear exposed vs control logic
Statistically filtered results
Comparability across brands or creatives
Limitations to Keep in Mind
Matching reduces usable sample size
Exposure must be measured reliably
Too many Control Demo variables can reduce power
Results apply to the matched population, not the full sample
When to Use Lift
Lift reports are best when you need to:
Prove effectiveness
Compare creatives or messages
Defend decisions with evidence
They are not designed for:
Media mix modelling
Budget optimisation
Very small samples
Summary
Lift reports isolate the impact of exposure by comparing exposed respondents to a carefully matched control group. When configured correctly, they provide one of the clearest and most defensible ways to demonstrate whether a stimulus genuinely worked.